In a previous post, one of our two SolarEdge inverters encountered an error and one quick fix is to reset the inverters. This year we had a similar issue.
Three days ago, our solar system encountered a grid voltage issue. Our XWPro inverter was in AC PassThru mode causing the SolarEdge inverters to detect the same grid issue. Our solar system is AC coupled. With XWPro handling grid-tied net metering, and battery charging and discharging, and SolarEdge for solar energy generation.
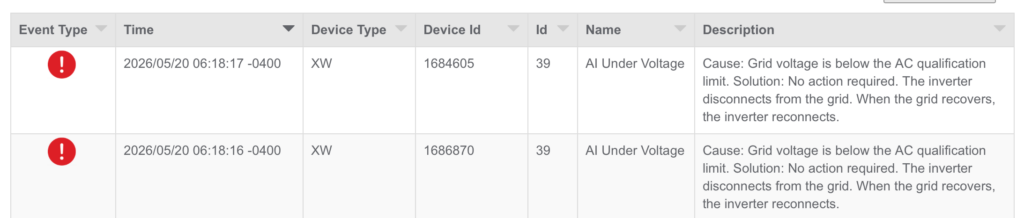
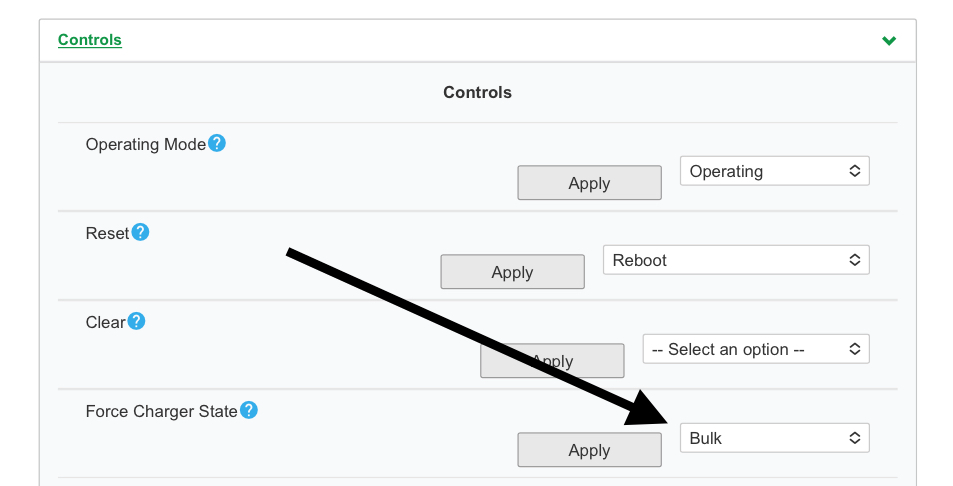
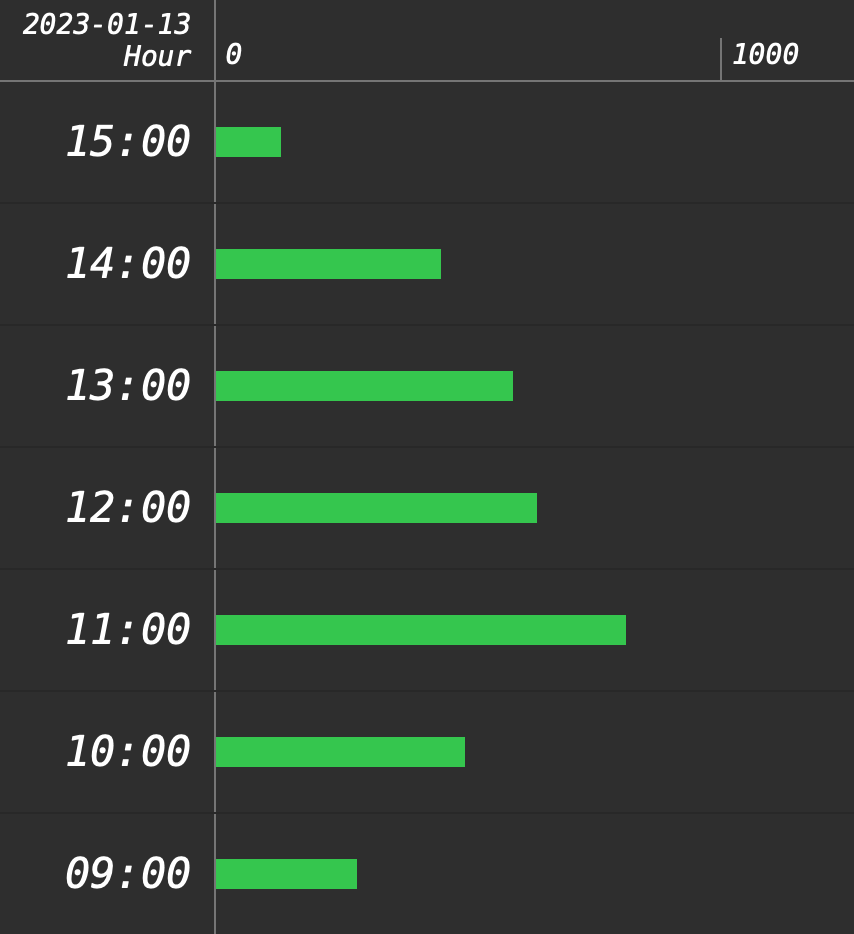
This grid event cause both SolarEdge inverters to go into a “Grid Profile Limit” mode where its AC output was limited to around 100W. When I reset both inverters through the main breaker panel, one recovered while the other continue with the limited output behaviour. To fix the second one, I had to perform a hard reset on the inverter. Below are the steps needed.
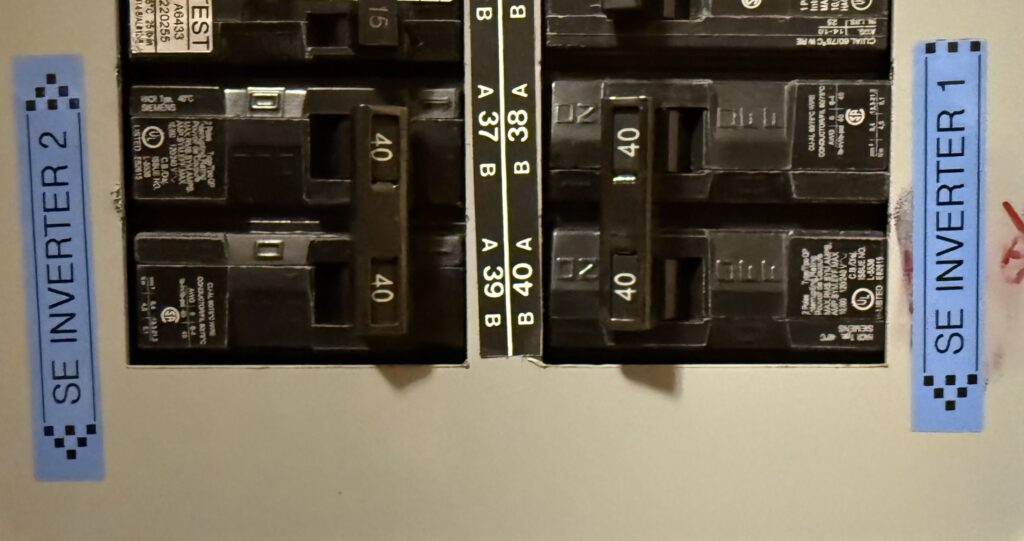
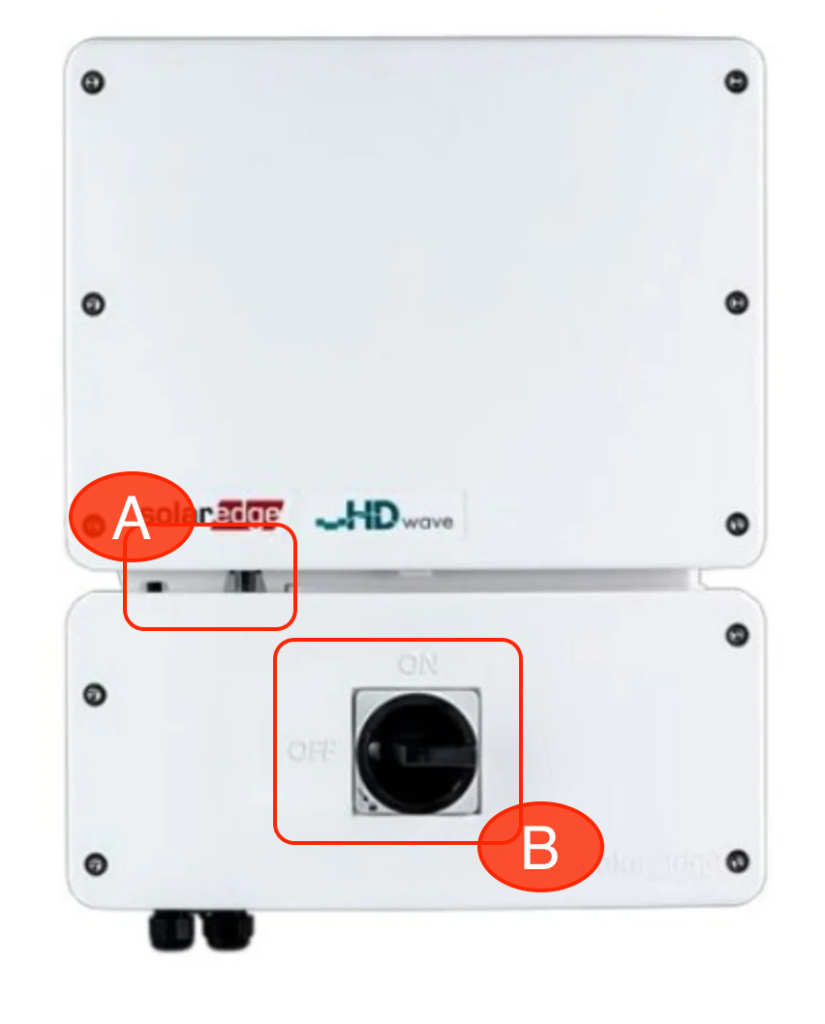
First I had to switch off the inverter at position A, and then turn off the DC disconnect at position B. I then had to switch off the breaker on the main panel.
The important part is to wait 5 to 10 minutes to wait for the inverter to discharge for the full reset to happen.
Once the time has passed, perform the action in reverse. Turn back on the breaker, the DC disconnect (B), and then finally turn back on the inverter (A).
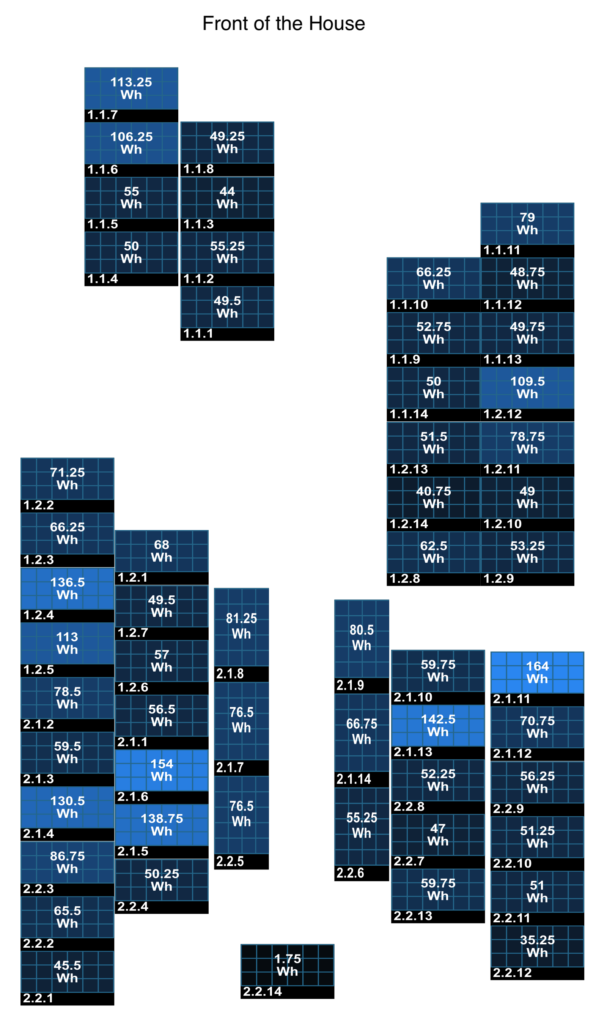
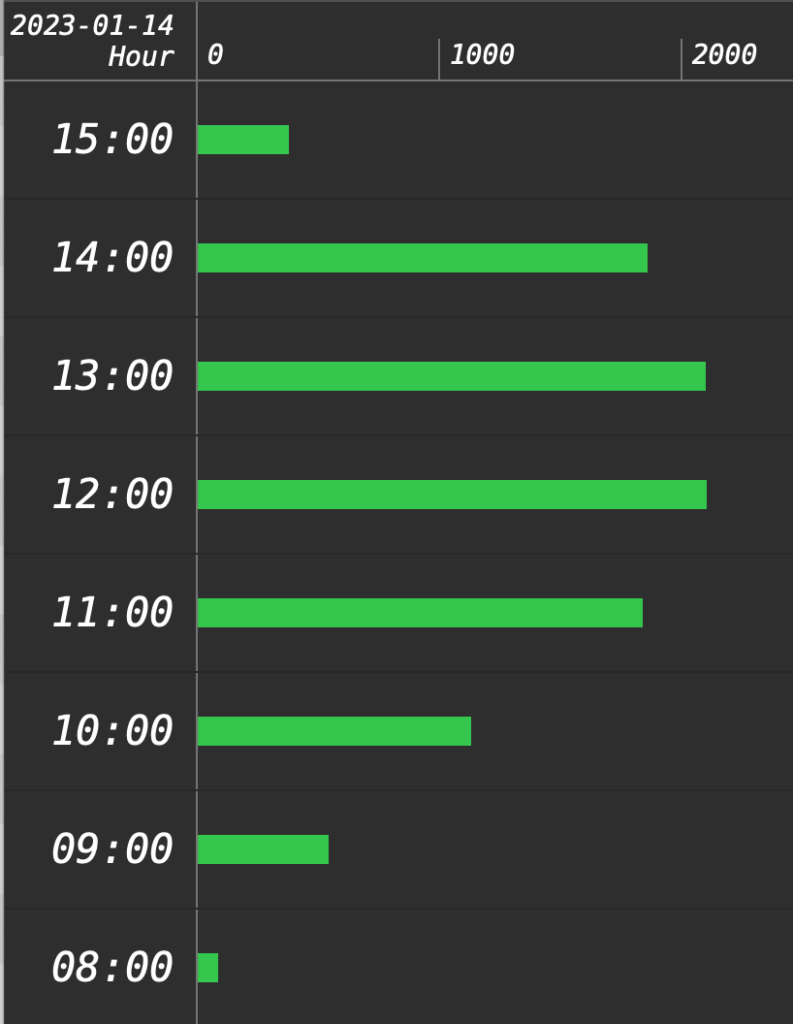
Luckily after this hard reset procedure, the second SolarEdge inverter has been fully restored with normal operation.