
Winter has arrived, and our solar production is seeing a sizeable drop in production. Although the month of November is still incomplete, here is our current solar production history so far:
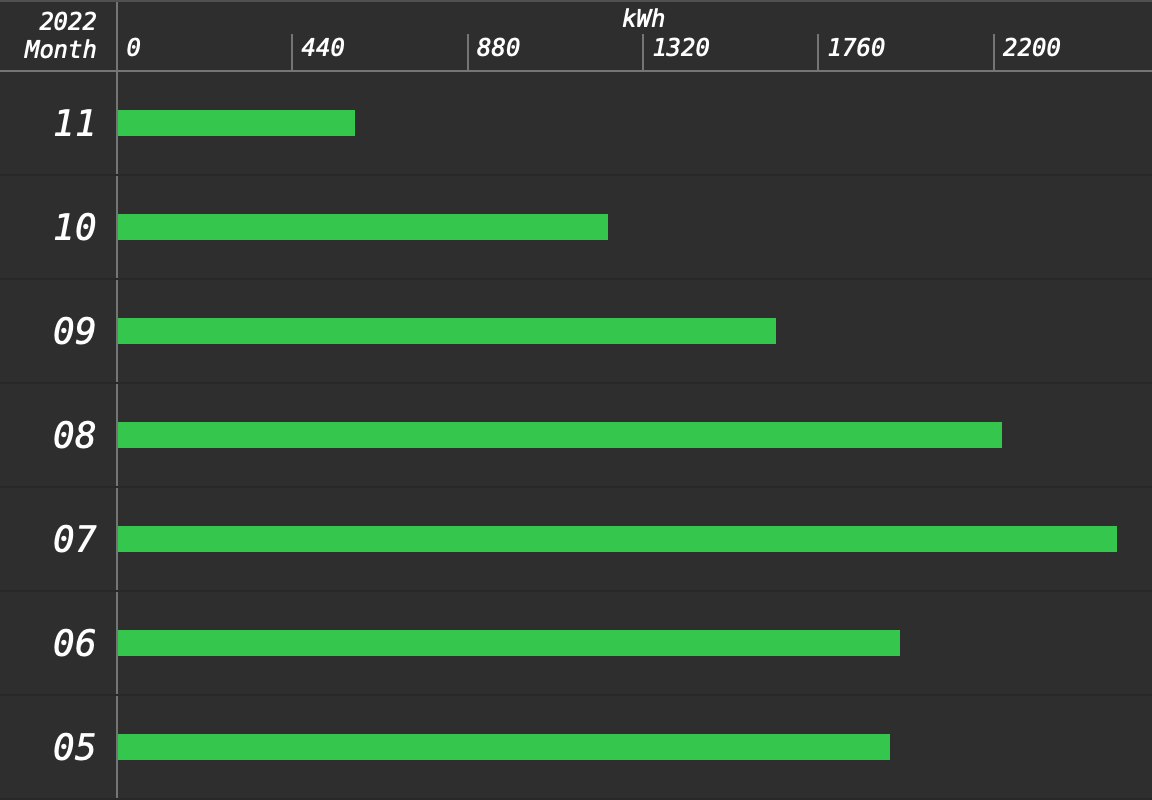
We were operating at 50% utilization when on of our SolarEdge inverters went down in June, and as pointed out earlier, November is only about 75% completed as of the time of the writing of this post.
Even with the above discrepancies in mind, we can see a gradual reduction in generation from the summer months. From a peak of over 2500 kWh in July to just around 1230 kWh in the month of October. That is half of our peak from July. Based on the November trend, we will have even less.
These reductions got me curious to the length of day variation through the year, and I found this handy chart:
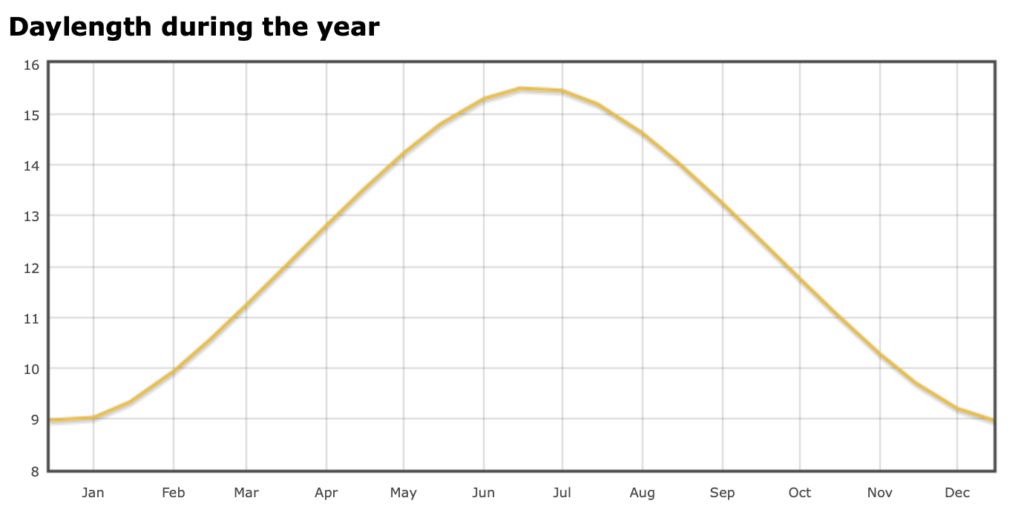
The above chart is customized by our home location of course. From trough to peak, there is a difference of about a 6.5 hours! I must say, I knew there is a difference between the longest and shortest days, but seeing number was a bit of a shock. These short days are made worst by lowest sun elevation on our Southern horizon during the winter months.
It will be interesting to see how much power we end up generating during December which will be our lowest generating month, per the above chart.