New AI Server

In a previous post, I commented on our AI server containing an old P40 GPU failed. We replaced our server with the following parts.

ComponentDescription
CPUAMD Ryzen 9 9900X 4.4 GHz 12-Core Processor
CPU CoolerThermalright Peerless Assassin 120 SE 66.17 CFM CPU Cooler
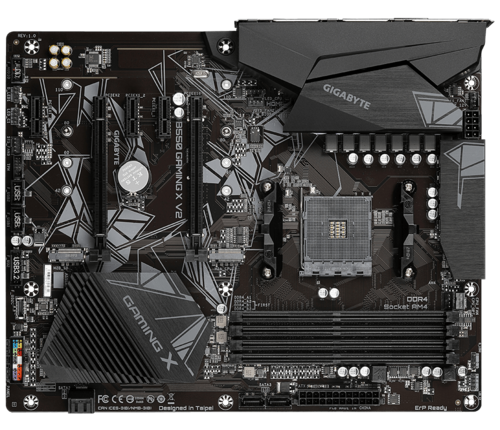
MotherboardAsus B650E MAX GAMING WIFI ATX AM5 Motherboard
MemoryCrucial Pro 64 GB (2 x 32 GB) DDR5-6000 CL40 Memory
StorageSamsung 990 Pro 2 TB M.2-2280 PCle 4.0 X4 NVME Solid State Drive
GPU2 x EVGA FTW3 ULTRA GAMING GeForce RTX 3090 24 GB Video Card (refurbished)
CaseFractal Design Meshify 3 XL ATX Full Tower Case
Power SupplySeaSonic PRIME TX-1600 ATX 3.1 1600 W 80+ Titanium Certified Fully Modular ATX Power Supply

I purchased all of our components at Amazon and the total (including shipping and taxes) came to to be $6,271.22. The most expensive parts were the GPU ($2,979.98), the power supply ($903.95), and then the memory ($843.19). All prices are quoted in Canadian dollars.

I had no issues in building the computer.

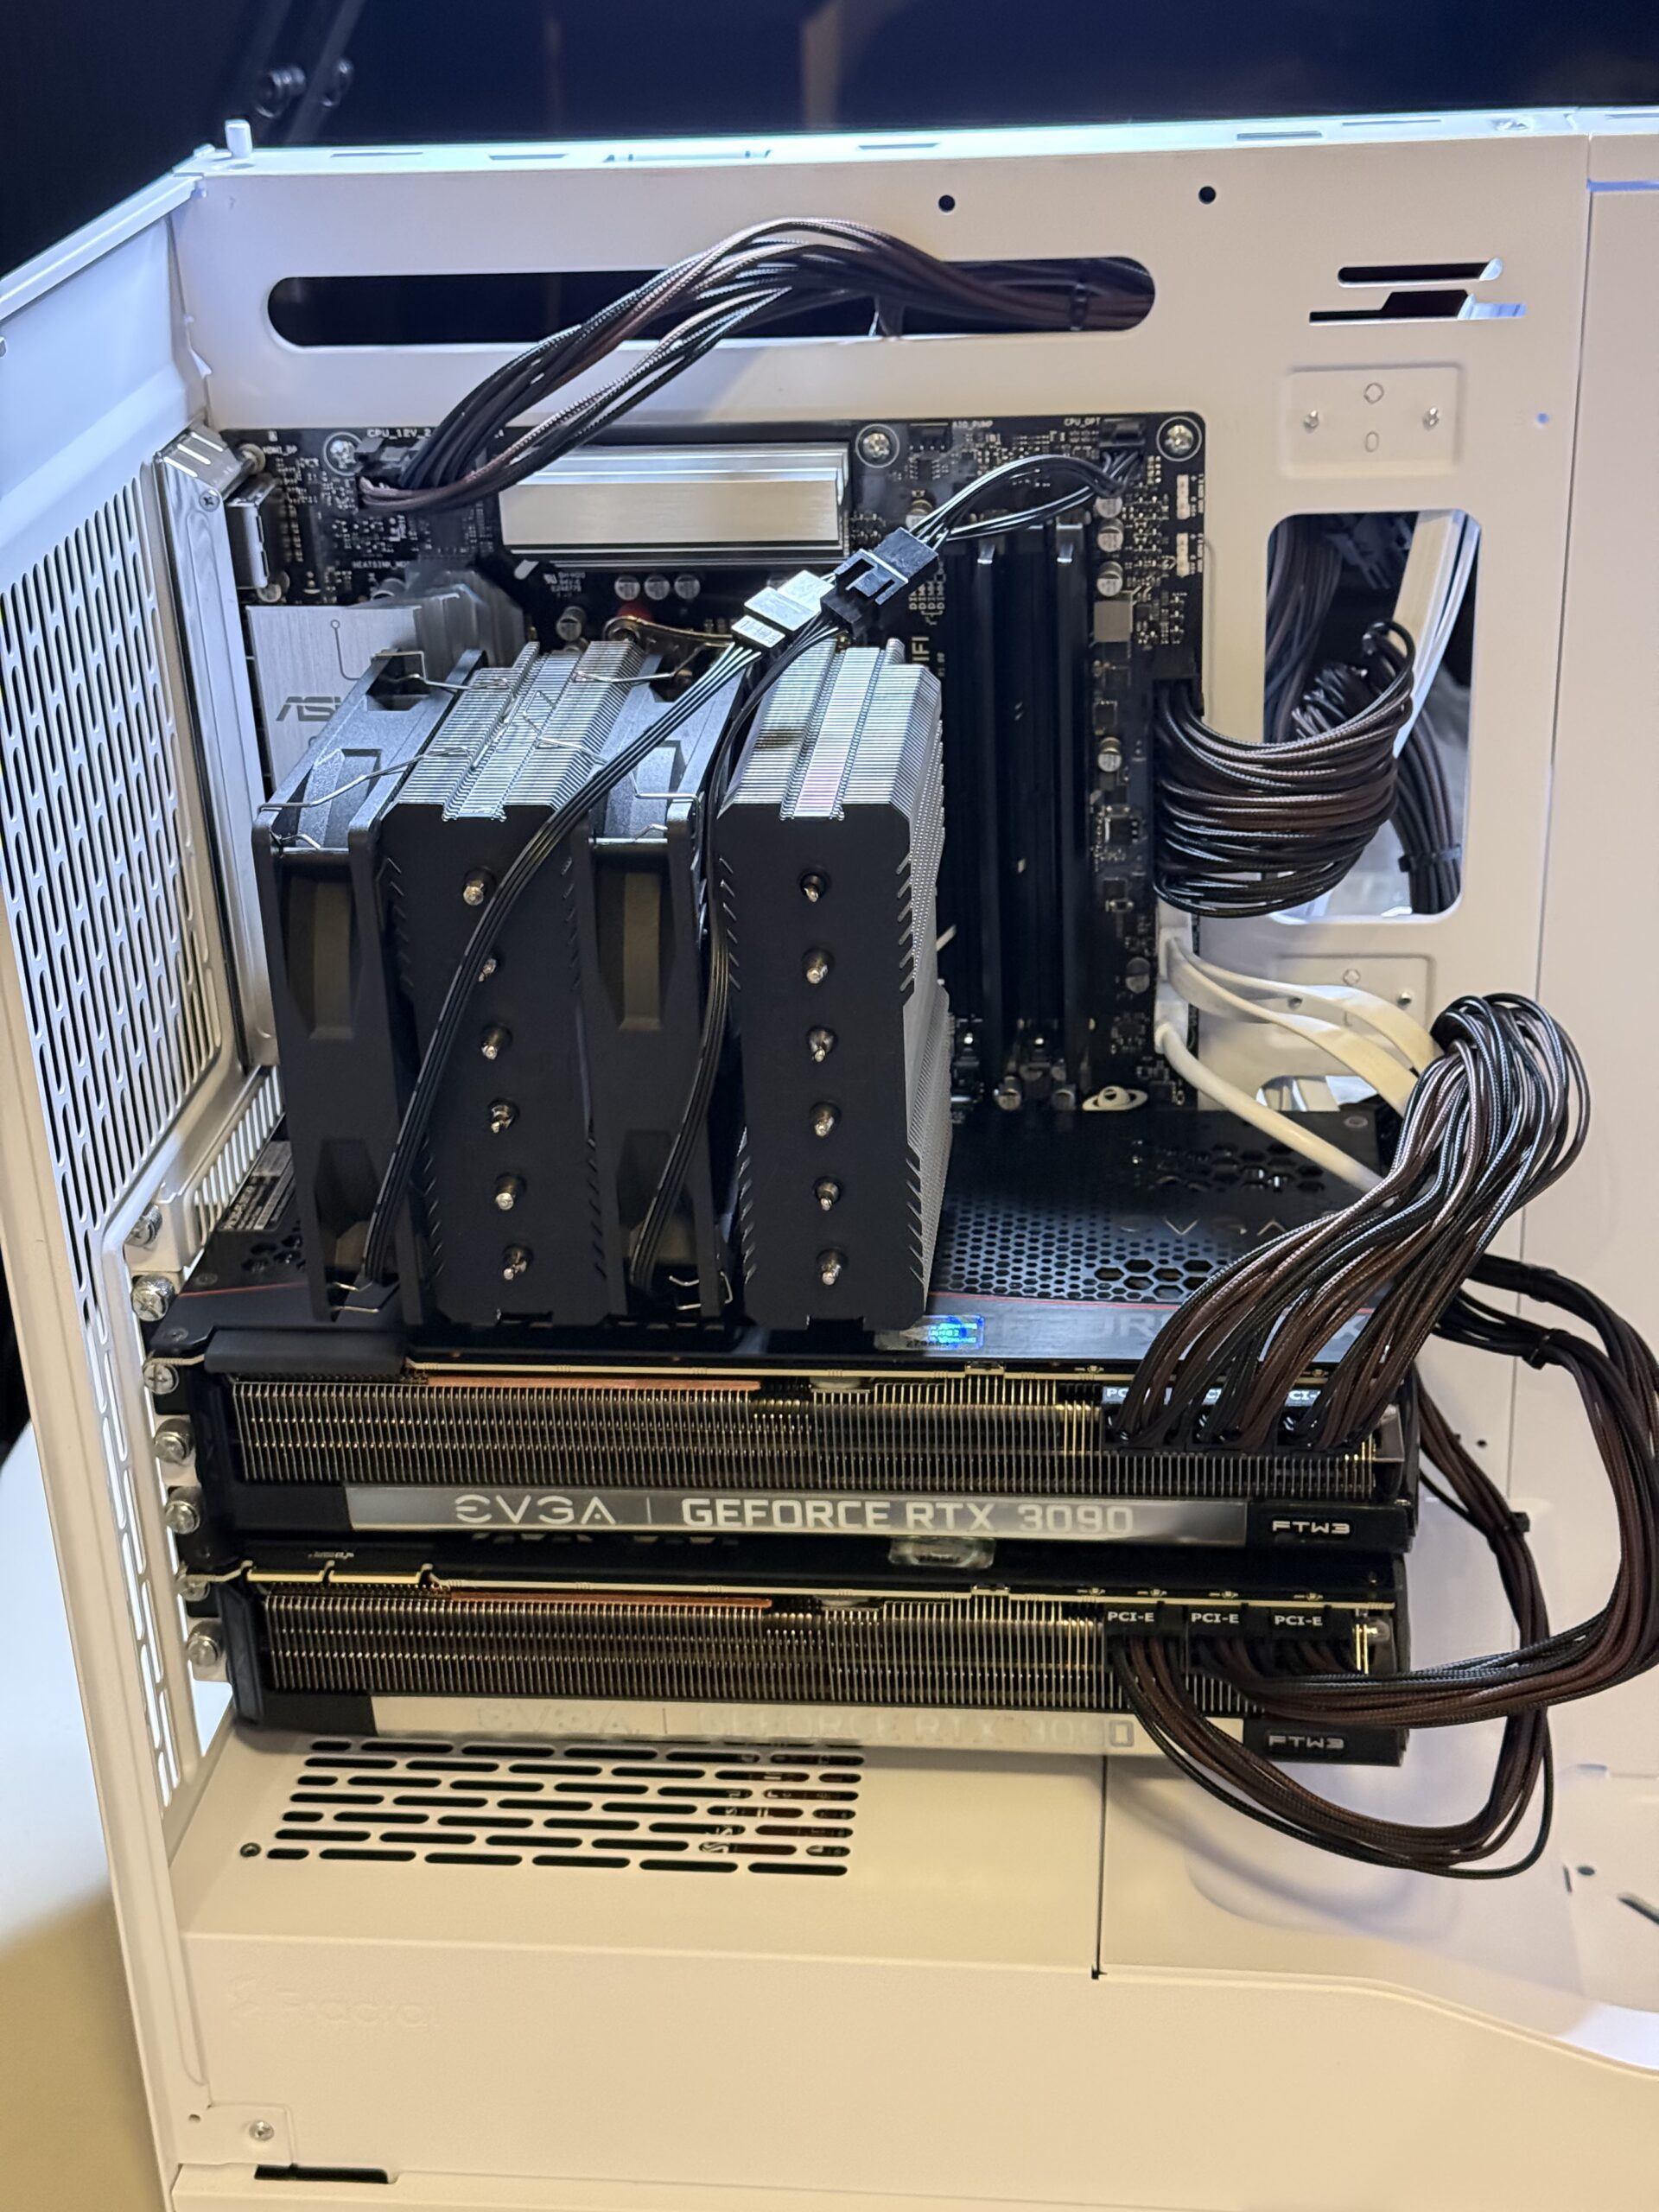
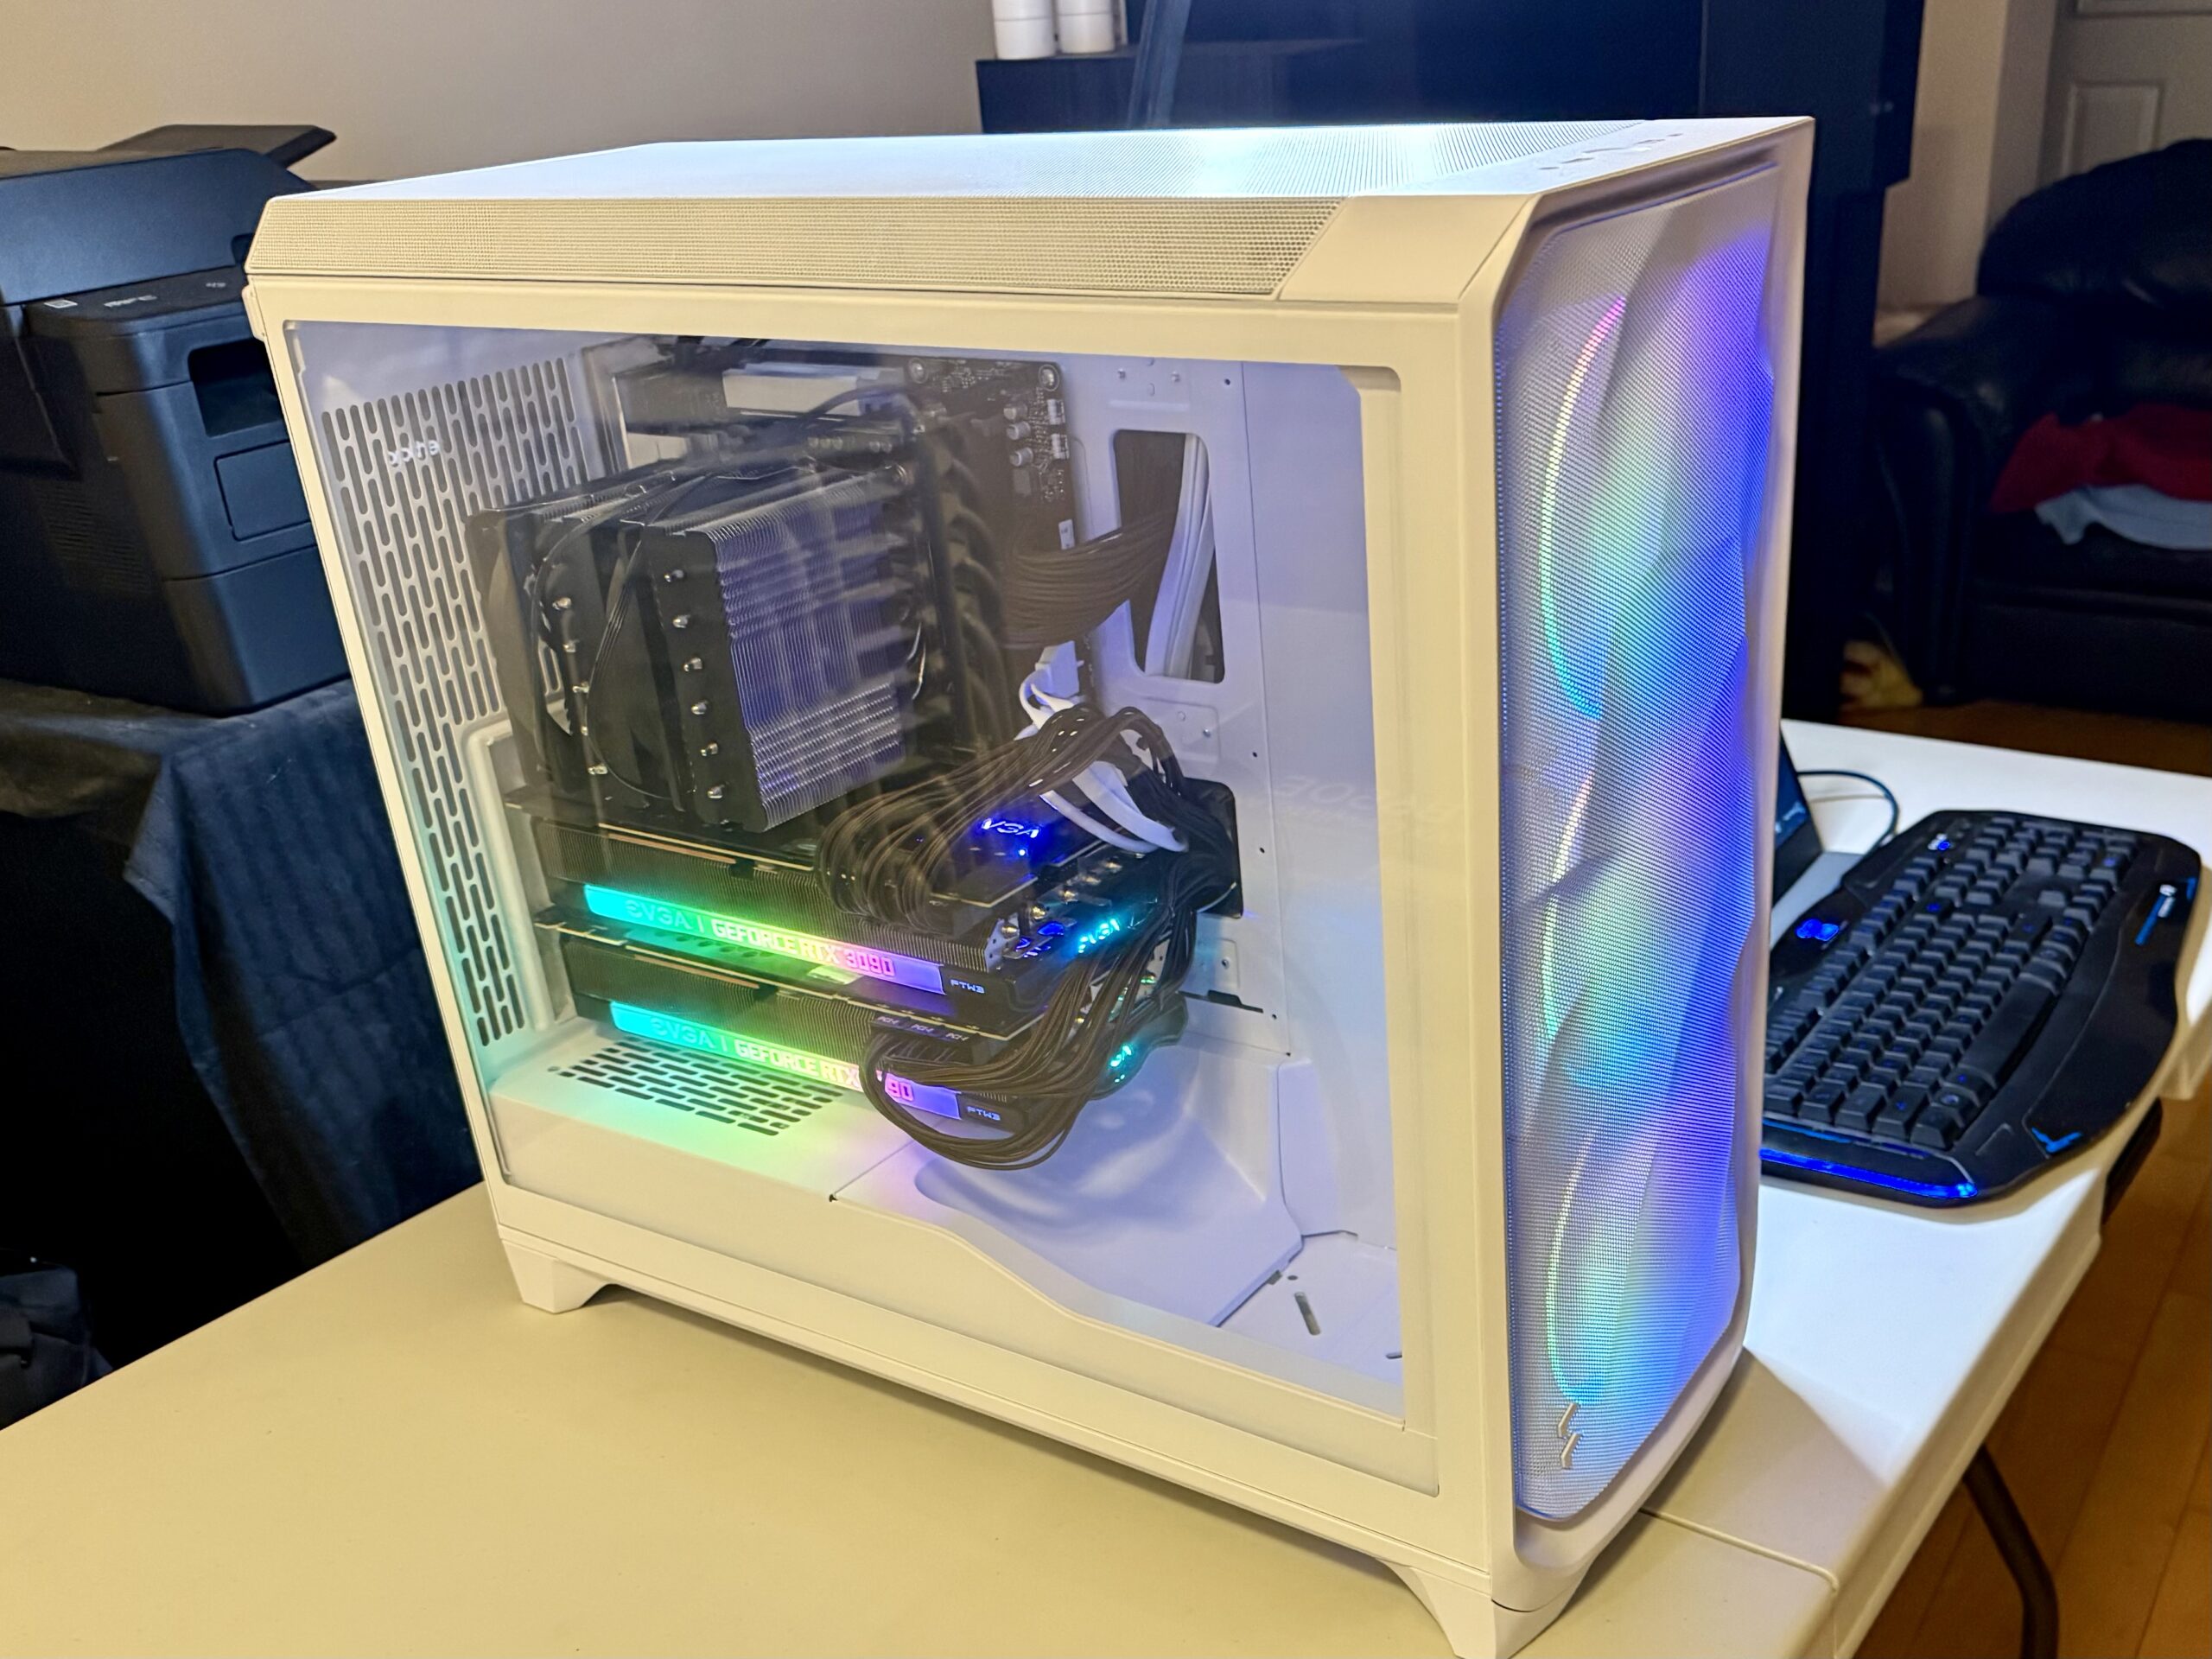
As you can see above, after the CPU cooler and the GPU’s were installed you can barely see the motherboard. Although there are still PCIe slots available, there is no more room to actually place new PCIe cards. We still have two more DIMM slots, so we can consider a future memory upgrade.

One of the main concerns I had was to plug this computer into an electrical socket that will not trip any of my breakers. The 1,600W power supply is awfully close to the maximum theoretical limit of a 15A breaker in our house, which would be around 1,800W. This server is too powerful for any of my current UPS units or power bars. It will have to be connected directly to a wall on a circuit that is not loaded by other appliances.

After testing the memory using MemTest, I installed Ubuntu Server 24.04.3 LTS. To prepare the machine for AI work load, I will then need to install Nvidia CUDA.

Installing CUDA

The first step that I did was to install the Nvidia CUDA. I followed the steps here for Ubuntu. I specifically follow the Network Repository Installation directions.

❯ sudo su -
# wget https://developer.download.nvidia.com/compute/cuda/repos/ubuntu2404/x86_64/cuda-keyring_1.1-1_all.deb
# dpkg -i cuda-keyring_1.1-1_all.deb

# apt install cuda-toolkit
# apt install nvidia-gds
# reboot

After the reboot, I tested CUDA by doing the following:

# nvidia-smi              

Installing vLLM

I then proceeded to install vLLM using the Quick Start guide for Nividia CUDA.

However I just use the Quick Start guide as a guidance. Ultimately I followed the following steps:

❯ sudo apt install build-essential python3.12-dev

❯ mkdir py_vllm
❯ cd py_vllm

❯ python3 -m venv vllm_cuda13_env
❯ source vllm_cuda13_env/bin/activate

❯ pip install torch-c-dlpack-ext
❯ pip install torch torchvision --index-url https://download.pytorch.org/whl/cu130
❯ pip install vllm --pre --extra-index-url https://wheels.vllm.ai/nightly

I tried to run vLLM using Podman but I always run out of memory for certain models, so I chose the Python method of deployment.

I then try to run it with Qwen/Qwen3-14B from Hugging Face. Since I have two GPU’s, I set the tensor-parallel-size to 2.

export VLLM_USE_V1=1 vllm serve Qwen/Qwen3-14B --tensor-parallel-size=2

It took a minute or two to download the model and initialize the GPU’s. Once it is up and running, I verified that it was running by using a simple curl command.

❯ curl http://localhost:8000/v1/models | jq .
  % Total    % Received % Xferd  Average Speed   Time    Time     Time  Current
                                 Dload  Upload   Total   Spent    Left  Speed
100   463  100   463    0     0   615k      0 --:--:-- --:--:-- --:--:--  452k
{
  "object": "list",
  "data": [
    {
      "id": "Qwen/Qwen3-14B",
      "object": "model",
      "created": 1766511858,
      "owned_by": "vllm",
      "root": "Qwen/Qwen3-14B",
      "parent": null,
      "max_model_len": 40960,
      "permission": [
        {
          "id": "modelperm-bc2e247073d50d67",
          "object": "model_permission",
          "created": 1766511858,
          "allow_create_engine": false,
          "allow_sampling": true,
          "allow_logprobs": true,
          "allow_search_indices": false,
          "allow_view": true,
          "allow_fine_tuning": false,
          "organization": "*",
          "group": null,
          "is_blocking": false
        }
      ]
    }
  ]
}

To deploy a model, I created the following systemd unit file in /etc/systemd/system called vllm.service. This way vLLM will automatically start when the host is rebooted.

[Unit]
Description=vLLM OpenAI Compatible Server
After=network.target

[Service]
# User and Group to run the service as (e.g., 'youruser', 'yourgroup')
User=kang
Group=kang
# Set the working directory
WorkingDirectory=/home/kang/py_vllm
Environment=VLLM_USE_V1=1

# The command to start the vLLM server
# Use 'exec' to ensure systemd correctly manages the process
ExecStart=/home/kang/py_vllm/vllm_cuda13_env/bin/python -m vllm.entrypoints.openai.api_server --model Qwen/Qwen3-14B --host 0.0.0.0 --port 8000 --tensor-parallel-size 2 --enable-auto-tool-choice --tool-call-parser hermes

# Restart the service if it fails
Restart=always

[Install]
WantedBy=multi-user.target

I used 0.0.0.0 as the host so that any machine on the network can connect to the service. If you use 127.0.0.1, only local sessions can connect.

To enable the above service, I had to do the following:

❯ sudo systemctl daemon-reload
❯ sudo systemctl enable vllm.service
❯ sudo systemctl start vllm.service

I also enabled tooling for my Opencode.ai experiments. vLLM ended up using all of 48GB VRAM on both GPU’s for the Qwen LLM as well as for caching. Impressive!

Installing Podman and Prepare for Quadlets

For everyday chats, I also configured a version of Perplexica. I chose to use Podman to install this, specifically using Podman Quadlet. The idea is to run Perplexica under my user id (kang), instead of running it as root. Our first step is to install Podman and prepare our user account for quadlets.

Note aside from explicit sudo references all other commands are run as the user.

Install Podman:

sudo apt install podman

The container requires user and group ids so we need to map id spaces to my user account.

sudo usermod --add-subuids 100000-170000 --add-subgids 100000-170000 ${USER}

cat /etc/subuid
cat /etc/subgid

We need to have an active user session for the container after a reboot, so we need my account to linger around.

sudo loginctl enable-linger ${USER}

We need to proactively increase the kernel key size to avoid any exceeding quota situations like, “Disk quota exceeded: OCI runtime error”. Not just for this container, but also for any other future containers.

echo "kernel.keys.maxkeys=1000" | sudo tee -a /etc/sysctl.d/custom.conf

Lastly, we need to prepare two directories for the containers. The first will house the systemd unit definition of the container. The second is a directory that will act as local storage for the container.

mkdir -p $HOME/.config/containers/systemd
mkdir -p $HOME/containers/storage

If we have any previous containers running, we need to perform a system migrate. I did not perform this, because I ensure that I had no other Podman containers running. You also can enable the auto update feature for podman. I also did not do this, as I prefer to this manually.

podman system migrate
systemctl --user enable --now podman-auto-update

For a more control networking experience and behaviour, we want to create our own container network. This will also help with DNS resolution. We need to create the network definition in $HOME/.config/containers/systemd/${USER}.network be sure to replace ${USER} reference below with the actual user account name.

[Unit]
Description=${USER} network
After=podman-user-wait-network-online.service
 
[Network]
NetworkName=${USER}
Subnet=10.168.0.0/24
Gateway=10.168.0.1
DNS=192.168.168.198
 
[Install]
WantedBy=default.target

We can then enable this network with the following commands:

systemctl --user daemon-reload
systemctl --user start ${USER}-network

podman network ls

The last command just verifies that the network is running and visible to Podman.

Installing Perplexica

Now that our Quadlet environment for the user account is all prepared, we can then proceed to install Perplexica.

First we need to create two local directories that Perplexica will use.

mkdir -p $HOME/containers/storage/perplexica/data
mkdir -p $HOME/containers/storage/perplexica/uploads

We then need to define the container in $HOME/.config/containers/systemd/perplexica.container:

[Unit]
Description=Perplexica

[Container]
ContainerName=perplexica
Image=docker.io/itzcrazykns1337/perplexica:latest
AutoUpdate=registry

HealthCmd=curl http://localhost:3000
HealthInterval=15m
UserNS=keep-id:uid=1000,gid=1000

Network=kang.network
HostName=perplexica
PublishPort=3000:3000

Volume=%h/containers/storage/perplexica/data:/home/perplexica/data
Volume=%h/containers/storage/perplexica/uploads:/home/perplexica/uploads

[Service]
Restart=always
TimeoutStartSec=300

[Install]
WantedBy=default.target

Be sure to double check your account uid and gid is 1000. If not, then replace the above appropriately.

Now we can start Perplexica.

systemctl --user daemon-reload
systemctl --user start perplexica

Note that the above commands are run with the user account and not with sudo or as root. Also note the --user option.

Once the service is running, you can get its logs by doing the following:

journalctl --user -u perplexica

You can also see all containers running as quadlets using:

systemctl --user status

With Perplexica running, we can proceed to its Web UI (http://localhost:3000) using our browser and point to our vLLM instance by creating an OpenAI connection type.

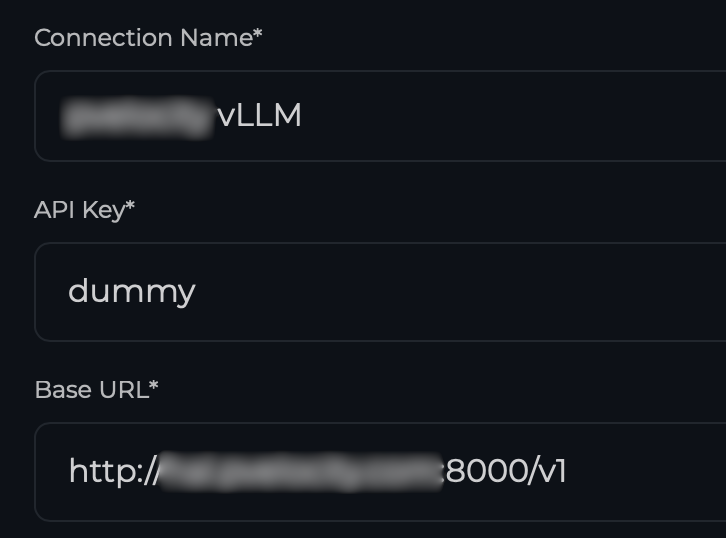
Once the connection is established, you can proceed to add the Chat and Embedding Models. In our case I used Qwen/Qwen3-14B as the model key. This is the same as the model id that vLLM is currently serving. The model name can be anything you assign.

That is it! We now have a local chat service with Perplexica, and I can use the OpenAI compatible API with vLLM.

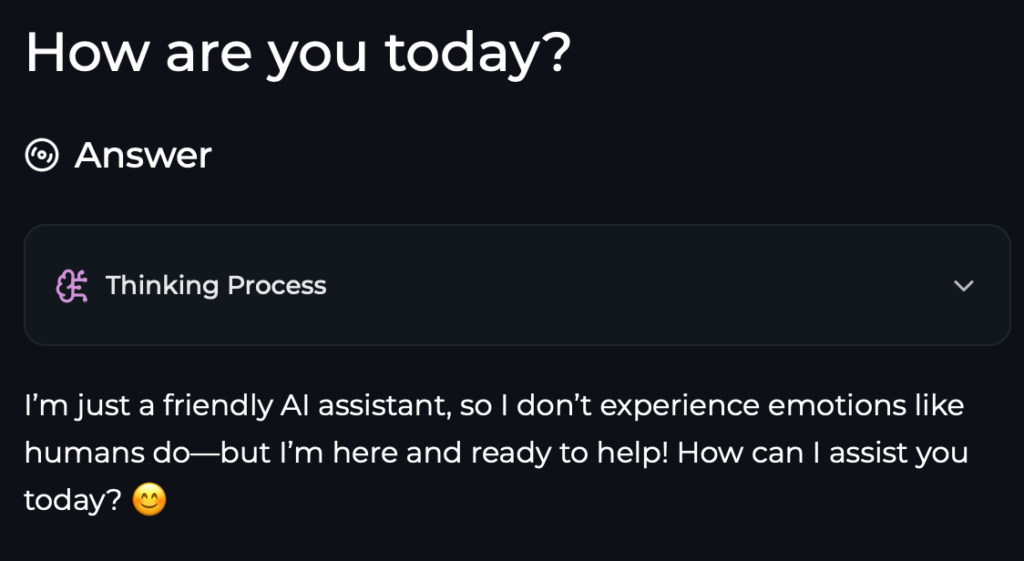
Here is an example of using CURL with the API:

❯ curl -X POST "http://localhost:8000/v1/responses" \
  -H "Content-Type: application/json" \
  -d '{
    "model": "Qwen/Qwen3-14B",
    "input": "How are you today?"
  }' | jq -r '.output[0].content[0].text'
  % Total    % Received % Xferd  Average Speed   Time    Time     Time  Current
                                 Dload  Upload   Total   Spent    Left  Speed
100  1791  100  1721  100    70    448     18  0:00:03  0:00:03 --:--:--   466
<think>
Okay, the user asked, "How are you today?" I need to respond appropriately. First, I should acknowledge their greeting and express that I'm doing well. Since I don't have feelings, I can't experience emotions, but I can simulate a friendly response. I should keep it positive and open-ended to encourage further conversation. Maybe add an emoji to keep it friendly. Also, I should invite them to ask questions or share something. Let me check if the response is natural and not too robotic. Avoid any technical jargon. Make sure it's concise but warm. Alright, that should work.
</think>

I'm doing great, thank you! I'm always ready to chat and help out. How about you? 😊 What's on your mind today?

UPS Monitoring

We have several UPS (Uninterruptible Power Supply) units around the house. They are there to prevent power interruptions to networking equipment and computer servers. When you are into home automation, keeping these services up and running is almost essential.

Previously this year, I noticed one of the UPS unit keeps on chirping and the body of the UPS unit was warm to the touch. I noticed on the LED display, that its battery is due to be replaced. This was not an issue. However I treated this as a cautionary tale because some of my UPS units were situated within the house that I rarely visit, so I may not hear the beeping alerts and may end up being a potential fire hazard should the battery misbehave. I decided that I needed to monitor my UPS units more frequently.

I started to learn about NUT (Network UPS Tools), and went on a mission to deploy this solution so that I can centrally monitored all of my UPS on a single web site. The first step is to ensure that all of my UPS can physically communicate its status to a computer host. This means they all have to be connected with a USB port.

Once communication is established, I then had to install NUT software on each of the computer hosts. My UPS units were installed on different hosts consisting of Raspberry PI, Ubuntu Linux, and Mac, so I had to configure each properly. Below is a summary of the configuration steps.

Linux & Raspberry Pi configuration:

First install the NUT software

# apt update
# apt install nut nut-server nut-client
# apt install libusb-1.0-0-dev

Ensure the UPS is connected to with USB.

# lsusb
Bus 001 Device 001: ID 1d6b:0002 Linux Foundation 2.0 root hub
Bus 001 Device 002: ID 0764:0601 Cyber Power System, Inc. PR1500LCDRT2U UPS
Bus 002 Device 001: ID 1d6b:0003 Linux Foundation 3.0 root hub

Perform a scan.

# nut-scanner -U
[ups-name]
        driver = "usbhid-ups"
        port = "auto"
        vendorid = "0764"
        productid = "0601"
        product = "CP1500AVRLCD3"
        serial = "BHPPO7007168"
        vendor = "CPS"
        bus = "001"
        device = "002"
        busport = "008"
        ###NOTMATCHED-YET###bcdDevice = "0200"

Modify the following files in /etc/nut:

  • nut.conf
  • ups.conf
  • upsmon.conf
  • upsd.conf
  • upsd.users

Inside nut.conf:

MODE=netserver

Inside ups.conf: Copy the above output from nut-scanner into end of the file and be sure to change the ups-name into something that is unique.

Inside upsmon.conf: Remember to replace ups-name.

MONITOR ups-name 1 upsmon secret primary

Inside upsd.conf:

LISTEN 0.0.0.0 3493
LISTEN ::1 3493

Inside upsd.users:

[upsmon]
        password = secret
        actions = SET
        instcmds = ALL
        upsmon primary

Finally we need add a file in /etc/udev/rules.d which governs whether we can send commands to the UPS. We need to create a file called 99-nut-ups.rules and that file should contain the following content:

SUBSYSTEM=="usb", ATTRS{idVendor}=="0764", ATTRS{idProduct}=="0601", MODE="0660", GROUP="nut", OWNER="nut"

Note that idVendor and idProduct should be replaced with the appropriate data from the nut-scanner.

Once all of this is completed, we have to restart all the relevant services and driver.

udevadm control --reload-rules
udevadm trigger
systemctl restart nut-server.service
systemctl restart nut-client.service
systemctl restart nut-monitor.service
systemctl restart nut-driver@ups-name.service
upsdrvctl stop
upsdrvctl start

You can test it now by reading the current UPS status information. Below is an example with ups-computer-room.

# upsc ups-computer-room@localhost
Init SSL without certificate database
battery.charge: 100
battery.charge.low: 10
battery.charge.warning: 20
battery.mfr.date: CPS
battery.runtime: 2725
battery.runtime.low: 300
battery.type: PbAcid
battery.voltage: 26.0
battery.voltage.nominal: 24
device.mfr: CPS
device.model: CP1500AVRLCD3
device.serial: BHPPO7007168
device.type: ups
driver.debug: 0
driver.flag.allow_killpower: 0
driver.name: usbhid-ups
driver.parameter.bus: 001
driver.parameter.busport: 008
driver.parameter.device: 002
driver.parameter.pollfreq: 30
driver.parameter.pollinterval: 2
driver.parameter.port: auto
driver.parameter.product: CP1500AVRLCD3
driver.parameter.productid: 0601
driver.parameter.serial: BHPPO7007168
driver.parameter.synchronous: auto
driver.parameter.vendor: CPS
driver.parameter.vendorid: 0764
driver.state: updateinfo
driver.version: 2.8.1
driver.version.data: CyberPower HID 0.8
driver.version.internal: 0.52
driver.version.usb: libusb-1.0.27 (API: 0x100010a)
input.voltage: 122.0
input.voltage.nominal: 120
output.voltage: 122.0
ups.beeper.status: enabled
ups.delay.shutdown: 20
ups.delay.start: 30
ups.load: 21
ups.mfr: CPS
ups.model: CP1500AVRLCD3
ups.productid: 0601
ups.realpower.nominal: 900
ups.serial: BHPPO7007168
ups.status: OL
ups.test.result: Done and passed
ups.timer.shutdown: -60
ups.timer.start: -60
ups.vendorid: 0764

You can also perform actions on the UPS unit. First we can query a list of commands that we can execute on the UPS. Note that with this example the UPS is being queried by a remote host hence the usage of avs.localdomain instead of localhost.

# upscmd -l ups-computer-room@avs.localdomain
Instant commands supported on UPS [ups-computer-room]:

beeper.disable - Disable the UPS beeper
beeper.enable - Enable the UPS beeper
beeper.mute - Temporarily mute the UPS beeper
beeper.off - Obsolete (use beeper.disable or beeper.mute)
beeper.on - Obsolete (use beeper.enable)
load.off - Turn off the load immediately
load.off.delay - Turn off the load with a delay (seconds)
shutdown.reboot - Shut down the load briefly while rebooting the UPS
shutdown.stop - Stop a shutdown in progress
test.battery.start.deep - Start a deep battery test
test.battery.start.quick - Start a quick battery test
test.battery.stop - Stop the battery test
test.panel.start - Start testing the UPS panel
test.panel.stop - Stop a UPS panel test

Reading the above, we see that we can perform a quick battery test by sending the command test.battery.start.quick. We do this with:

upscmd -u upsmon -p secret ups-computer-room@avs.localdomain test.battery.start.quick

MaC configuration:

We install NUT with brew:

brew install nut

The configuration files are stored in /usr/local/etc/nut.

Since there is no lsusb or nut-scanner on the Mac, you can use the following command to see if the UPS is connected with USB or not.

system_profiler SPUSBHostDataType

You can also use:

pmset -g ps

The ups.conf file is more simple, because you don’t need the other details:

[ups-dining-room]
  driver = macosx-ups
  port = auto
  desc = "APC Back-UPS ES 550"

All other configuration files is the same and there is no need to create the /etc/udev/rules.d file.

I need to start nut when the Mac reboots, so I need to configure launchd for this. First I created two scripts, start.sh and stop.sh in the ~/Applications/nut. Below are their respective contents:

❯ cat start.sh
#!/usr/bin/env zsh

/usr/local/sbin/upsdrvctl start
/usr/local/sbin/upsd
/usr/local/sbin/upsmon

❯ cat stop.sh
#!/usr/bin/env zsh

/usr/local/sbin/upsmon -c stop
/usr/local/sbin/upsd -c stop
/usr/local/sbin/upsdrvctl stop

Next, we have to create a home.nut.custom.plist file in /Library/LaunchDaemons. It has the following contents:

<?xml version="1.0" encoding="UTF-8"?>
<!DOCTYPE plist PUBLIC "-//Apple//DTD PLIST 1.0//EN" "http://www.apple.com/DTDs/PropertyList-1.0.dtd">
<plist version="1.0">
  <dict>
    <key>Label</key>
    <string>home.nut.custom</string>
    <!-- Start script -->
    <key>ProgramArguments</key>
    <array>
      <string>/bin/zsh</string>
      <string>/Users/kang/Applications/nut/start.sh</string>
    </array>
    <!-- Stop script -->
    <key>StopProgram</key>
    <array>
      <string>/bin/zsh</string>
      <string>/Users/kang/Applications/nut/stop.sh</string>
    </array>
    <!-- Run at boot -->
    <key>RunAtLoad</key>
    <true/>
    <!-- Logging -->
    <key>StandardOutPath</key>
    <string>/var/log/nut.out.log</string>
    <key>StandardErrorPath</key>
    <string>/var/log/nut.err.log</string>
  </dict>
</plist>

We then have to enable the daemon.

sudo launchctl bootstrap system /Library/LaunchDaemons/home.nut.custom.plist

Now the NUT daemon will be running when we reboot the Mac.

PEANUT Installation

Once this is all done, I am then able to retrieve all of my UPS units’ status from anywhere on my network as long as I have the nut-client package installed and have access to the upsc command. We are now ready to install the PEANUT web interface using podman.

On a computer host that is running other centralized services within my house, We performed the following steps.

We created the following systemd unit file called: /etc/systemd/system/peanut.service, which contains the following:

# container-1518f57b9c9880dc5538fdd8c1a770993ab5a09dda03071b5a603142104831d2.service
# autogenerated by Podman 4.9.3
# Thu Dec 11 17:08:07 EST 2025

[Unit]
Description=Podman Peanut.service
Documentation=man:podman-generate-systemd(1)
Wants=network-online.target
After=network-online.target
RequiresMountsFor=%t/containers

[Service]
Environment=PODMAN_SYSTEMD_UNIT=%n
Restart=always
TimeoutStopSec=70
WorkingDirectory=/home/kang/peanut
ExecStart=/usr/bin/podman run \
        --cidfile=%t/%n.ctr-id \
        --cgroups=no-conmon \
        --rm \
        --sdnotify=conmon \
        -d \
        --replace \
        --name peanut \
        -v ./config:/config \
        -p 58180:8080 \
        --env WEB_PORT=8080 docker.io/brandawg93/peanut
ExecStop=/usr/bin/podman stop \
        --ignore -t 10 \
        --cidfile=%t/%n.ctr-id
ExecStopPost=/usr/bin/podman rm \
        -f \
        --ignore -t 10 \
        --cidfile=%t/%n.ctr-id
Type=notify
NotifyAccess=all

[Install]
WantedBy=default.target

The above file was generated with the podman utility itself using:

podman generate systemd --new --files peanut

For the above to work, there must be a container peanut running first, which we did with the following command just to temporary create the file. This also assumes a local config directory is created for the volume mapping.

podman run --name peanut -v ./config:/config --restart unless-stopped -p 58180:8080 --env WEB_PORT=8080 docker.io/brandawg93/peanut

Once the system file is created, we do the following to enable it.

sudo systemctl daemon-reload
sudo systemctl enable peanut.service
sudo systemctl start peanut

I did some reverse proxy settings on my Apache 2.0 server, and a CNAME record on my local DNS, and then I have my UPS monitoring system.

AI Server Bytes the Dust

I have an old Raspberry Pi running Volumio to stream my music library to my living room home theatre. This morning, I needed to perform an update from Volumio 3 to Volumio 4. After I did the upgrade, the Raspberry Pi acquired a new IP address, which I need to discover through my Unifi Dream Machine Pro (UDMPro) Max web based user interface. It is then that I noticed that all the virtual machines hosted using Proxmox running on our AI Server have dropped off from my network. This is the AI Server that I built back in August of 2023, and discussed in this post.

I thought all I needed to do was a reboot, still no network connection. The networking interface seems to be off. I plug in a keyboard into the server, and added a monitor. No video signal, and the keyboard did not respond, not even the NUMLOCK LED worked. This is not good. All signs point to a hardware failure.

I pulled out PCIe cards one by one and try to resuscitate the server. No good. With a bare-bones motherboard, memory, and CPU, it still did not respond. I couldn’t even get into the BIOS. The fans were spinning, and the motherboard diagnostic LED’s point to some error when it is trying to initiate video / VGA.

I ended up finding a possible replacement motherboard, Gigabyte B550 Gaming X V2, at a local Canada Computers for $129 (before tax), and some thermal paste for $9.99 (before tax) to reseat the CPU and the cooler.

Replacement Board

The good news is that after replacing the motherboard, I was able to get into the BIOS. However when I try to boot the machine with the used Nvidia P40 card, it failed to boot again. I had to forego this card. The GPU could have been damaged by the old mainboard, or the GPU could have been damaged first and caused the mainboard to fail. At this point I am too tired to play the chicken or the egg game. I simply left the card out, and restore Proxmox on the server. It will no longer be an AI server, but at least the virtual machines on the server can be recovered.

Proxmox boots but will not shutdown. I had to undo the PCIe passthrough configurations that I did when I build the AI Server. This involved editing the GRUB configuration so that all the special options are removed in /etc/default/grub:

GRUB_CMDLINE_LINUX_DEFAULT=""

Before it had configurations containing options to make use of IOMMU and the vfio modules. After this update, I had to perform the following commands:

update-grub
update-initramfs -u -k all

I then proceed to reboot the system, and the system behaved normally. During this process I also found out that Proxmox will not start normally if any of the mounts configured in /etc/fstab are not available. This threw me for a loop because the regular USB backup drive was disconnected when I was trying to resolve this issue.

Since the PCIe bus has different peripherals, I knew from my past experience which I detailed here, I have to edit the /etc/network/interfaces file with the new interface name. The following command really helped me identify the new name and which NIC I should pick, because there were multiple interfaces, and I wanted to pick the 2.Gbps one.

lshw -class network

In the end, all of the virtual hosts are now up and running. I hope this new motherboard proves to be more stable without the used P40 GPU. Fingers crossed!

Patch Panel Finally Installed

I purchased the patch panel from Amazon back in June of this year. Today I finally got around to installing it. One of the main reasons for the delay was that I had to properly ground the patch panel to an electrical outlet. I did this with an old PC power cable and solder the ground wire only to the metal frame of the patch panel.

In addition to the patch panel, I also purchased this wall mountable network rack. This 7U rack has enough room for our new 10Gbps networking equipment that I talked about in this post. These included the UDM Pro Max router / firewall, and our 10Gbps networking upgrade with our new USW Pro XG 10 PoE switch.

We also upgrade some of the satellite switches in the house with:

So we went from this 1Gbps backbone:

Old 1Gbps house networking infrastructure

To this, 10Gbps backbone:

New 10Gbps house networking infrastructure

Using the UDM Pro Max, we can have dual Internet Service Providers (ISP). We are currently using TelMax and Rogers with a 75% and 25% traffic split, respectively. If one goes down, the other automatically pickup all the traffic, so we have Internet redundancy.

The UDM Pro Max allows us to have our old UDM Pro to be a cold stand-by in case the unit fails.

I think we can all agree that the latter 10Gbps system is much neater. I’m quite happy with the reorganization and the upgrade.

After all of this, we now have the most current speed tests:

The above shows the TelMax speed test.
The above shows the Rogers speed test.

Today is the first time that I register advertised speed with my TelMax subscription.

Now our household wired networking infrastructure is ready for WiFi 7 upgrade. That is a project for next year.