
For those who want a visual chart to see where our tax brackets lie, I took the time to have ChatGPT AI generate a python program that created the following chart:
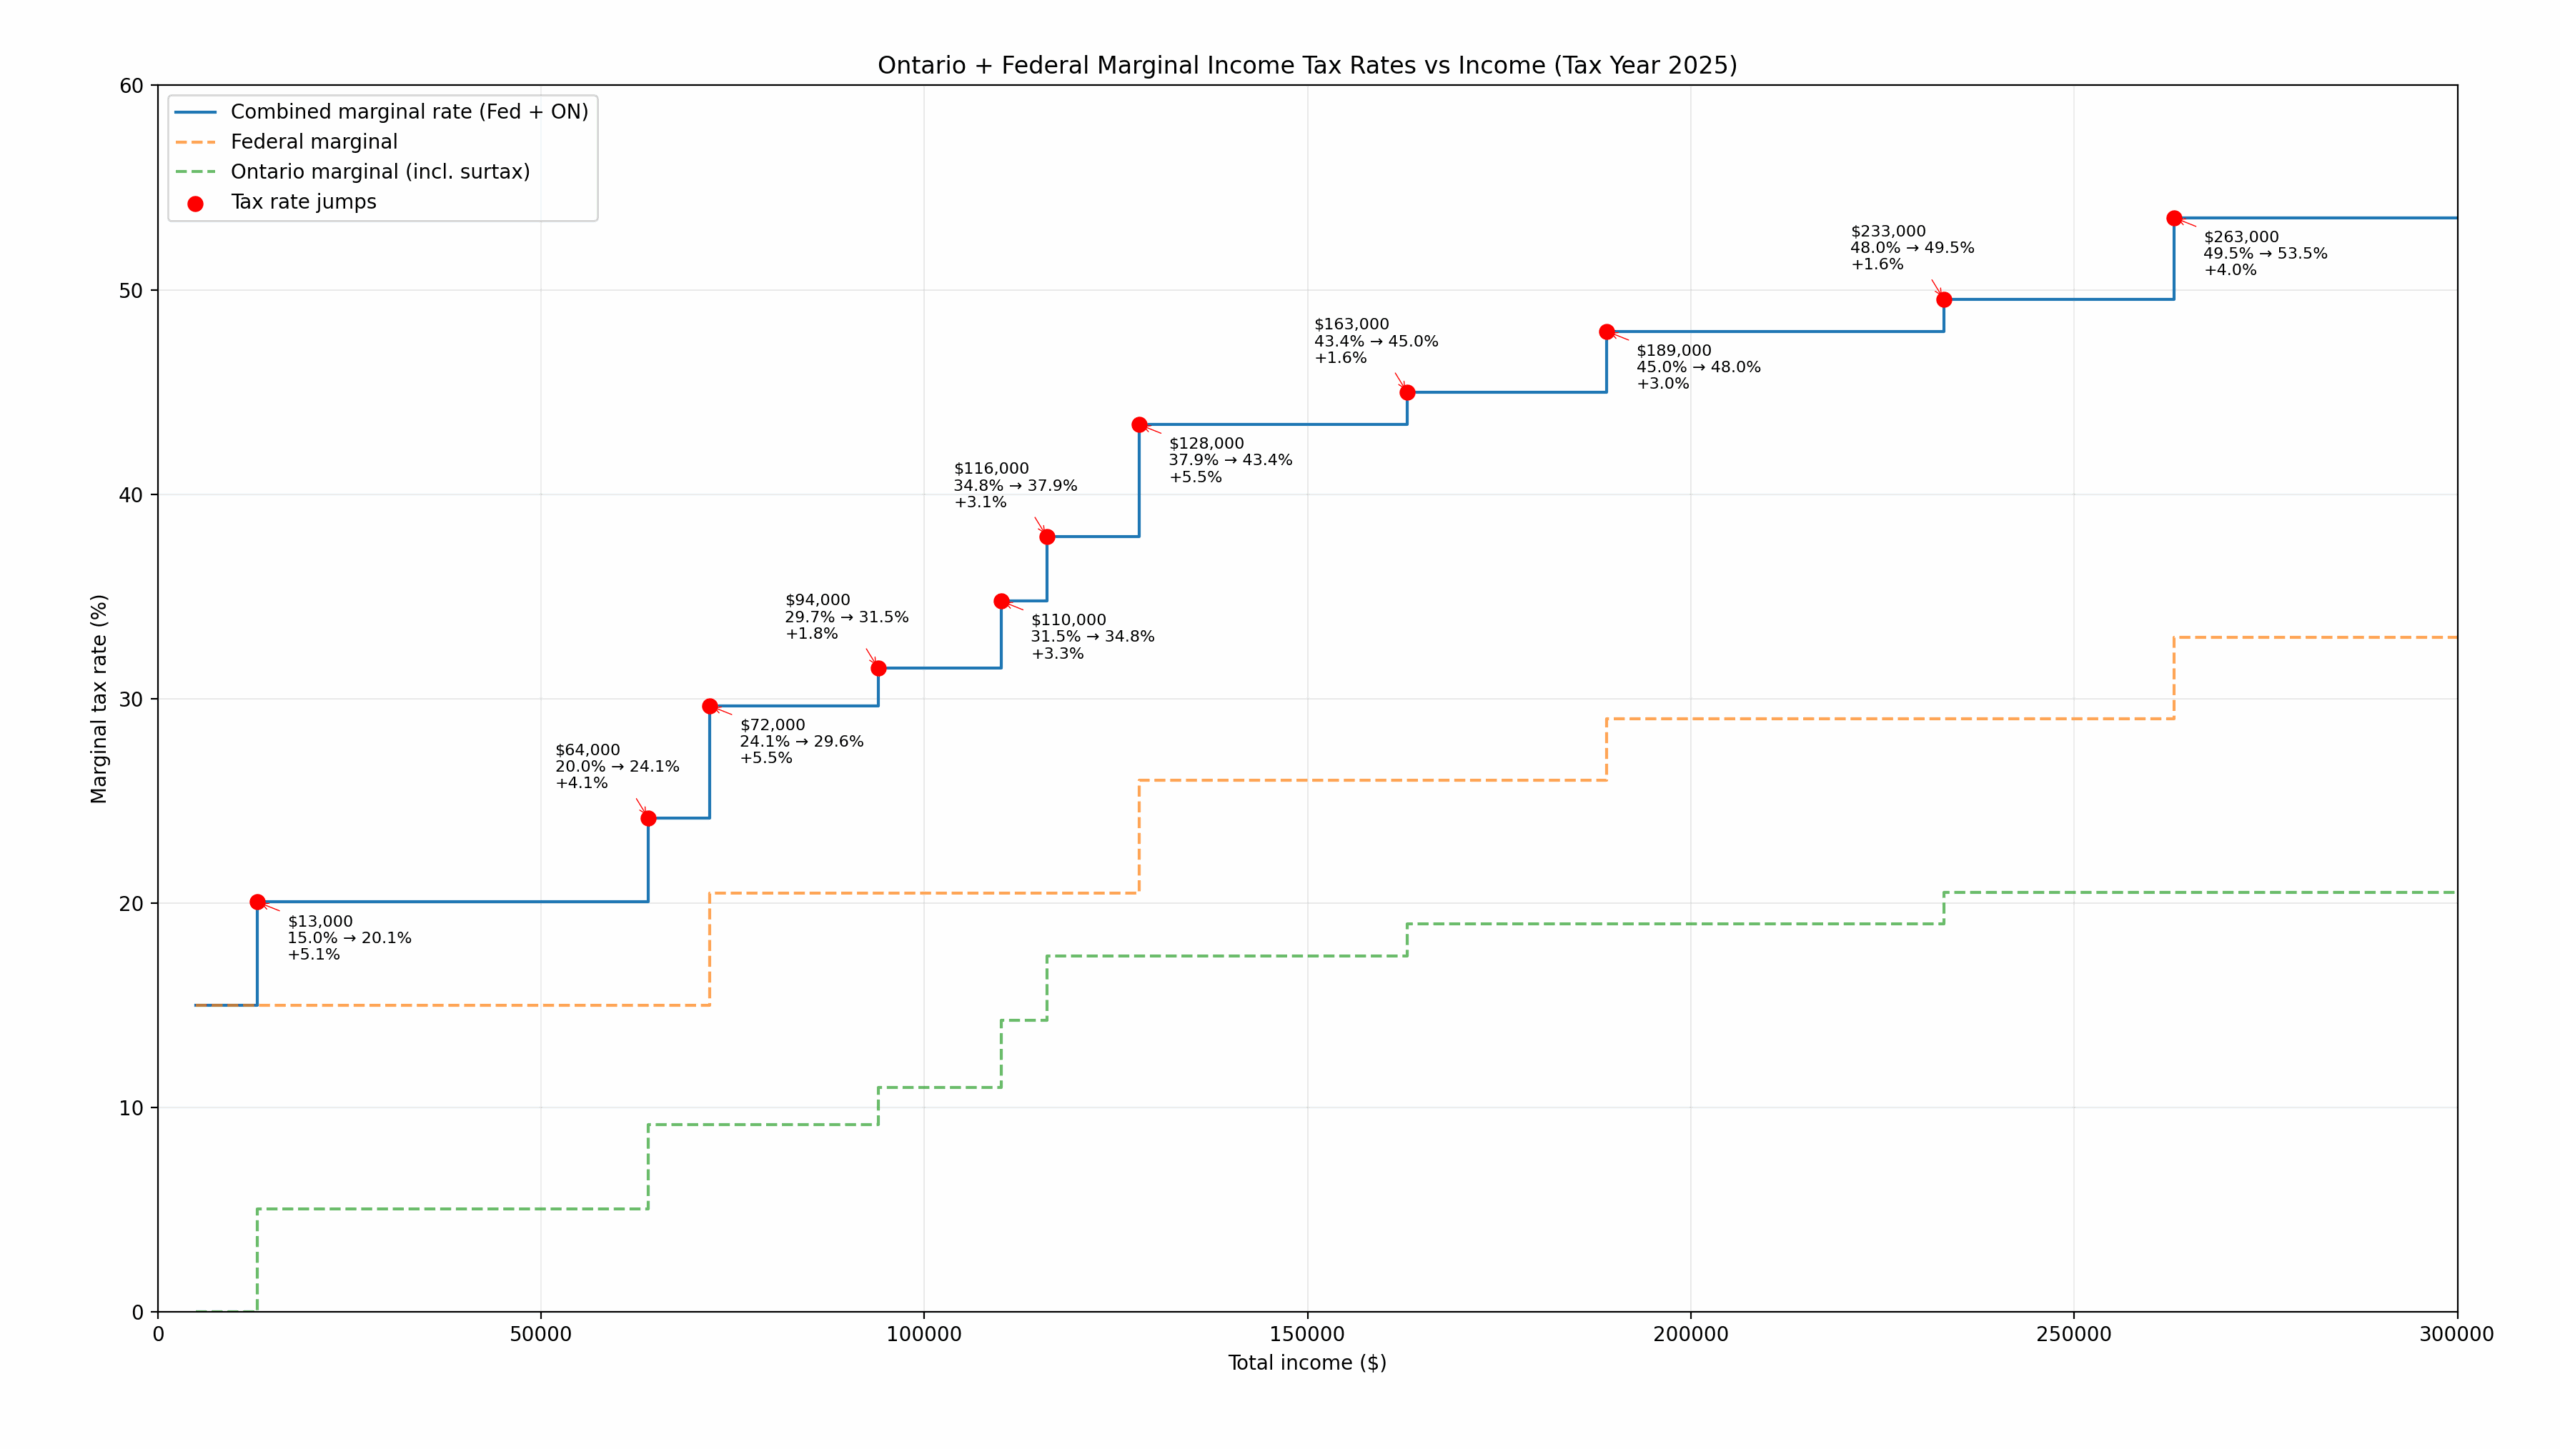
Salaries with significant tax rate jumps:
- $13,000: 15.0% → 20.1% (+5.1%)
- $64,000: 20.0% → 24.1% (+4.1%)
- $72,000: 24.1% → 29.6% (+5.5%)
- $94,000: 29.7% → 31.5% (+1.8%)
- $110,000: 31.5% → 34.8% (+3.3%)
- $116,000: 34.8% → 37.9% (+3.1%)
- $128,000: 37.9% → 43.4% (+5.5%)
- $163,000: 43.4% → 45.0% (+1.6%)
- $189,000: 45.0% → 48.0% (+3.0%)
- $233,000: 48.0% → 49.5% (+1.6%)
- $263,000: 49.5% → 53.5% (+4.0%)
This has been quite helpful in our tax planning. I hope you will find some utility with this.